Rule of 72 Compound Table Quick Reference Guide
Authentic reference chart and data matrix for Rule of 72 Compound Table in Personal Finance & KPIs. Use the interactive table below or print it / save it as a PDF with the button below.
Quick-Reference Table
The full data from this cheat sheet, right on the page.
| Annual Compound Return Rate (r) | Rule of 72 Doubling Time (Years) | Exact Logarithmic Doubling Time (ln 2 / ln(1+r)) | Rule of 72 Estimation Error (%) | Growth of $10,000 Investment After 24 Years | Typical Benchmark Asset Class / Financial Vehicle |
|---|---|---|---|---|---|
| 2.0% Annual Return | 36.0 Years (72 / 2) | 35.00 Years | +2.8% Error (Slight overestimate) | $16,084 (1.6x baseline) | High-Yield Savings Accounts (HYSA) / Money Market baseline |
| 4.0% Annual Return | 18.0 Years (72 / 4) | 17.67 Years | +1.8% Error | $25,633 (2.5x baseline) | U.S. Treasury Notes / High-Grade Corporate Bonds |
| 6.0% Annual Return | 12.0 Years (72 / 6) | 11.90 Years | +0.8% Error | $40,489 (4.0x baseline) | Conservative Balanced Portfolio (60/40 Stocks & Bonds) |
| 7.2% Annual Return (Exact Match) | 10.0 Years (72 / 7.2) | 9.97 Years | +0.3% Error (Near-perfect accuracy) | $53,109 (5.3x baseline) | Historical S&P 500 Real Return (Inflation-adjusted long term) |
| 8.0% Annual Return | 9.0 Years (72 / 8) | 9.01 Years | -0.1% Error | $63,412 (6.3x baseline) | Global Total Stock Market Index Fund (VT / Total Market) |
| 10.0% Annual Return | 7.2 Years (72 / 10) | 7.27 Years | -1.0% Error | $98,497 (9.8x baseline) | Historical S&P 500 Nominal Return (Pre-inflation 1926–2025) |
| 12.0% Annual Return | 6.0 Years (72 / 12) | 6.12 Years | -1.9% Error | $152,196 (15.2x baseline) | Aggressive Small-Cap / Technology Sector Growth Equity |
How to Use This Chart
Pin this chart where you work: it packs 7 entries and 6 columns (Annual Compound Return Rate (r), Rule of 72 Doubling Time (Years), Exact Logarithmic Doubling Time (ln 2 / ln(1+r)), Rule of 72 Estimation Error (%), Growth of $10,000 Investment After 24 Years, Typical Benchmark Asset Class / Financial Vehicle) into one printable page, built for quick lookups.
Scan down the Annual Compound Return Rate (r) column to your item, then read across for Rule of 72 Doubling Time (Years), Exact Logarithmic Doubling Time (ln 2 / ln(1+r)).
Example: for 2.0% Annual Return, the chart gives Rule of 72 Doubling Time (Years) of 36.0 Years (72 / 2).
- Compare values down a single column to spot the pattern before you commit to a choice.
- When two rows look close, the Typical Benchmark Asset Class / Financial Vehicle column usually breaks the tie.
- Print it once and keep it where you work — that's the whole point of a cheat sheet.
Printable Sheet Preview
High-Contrast Layout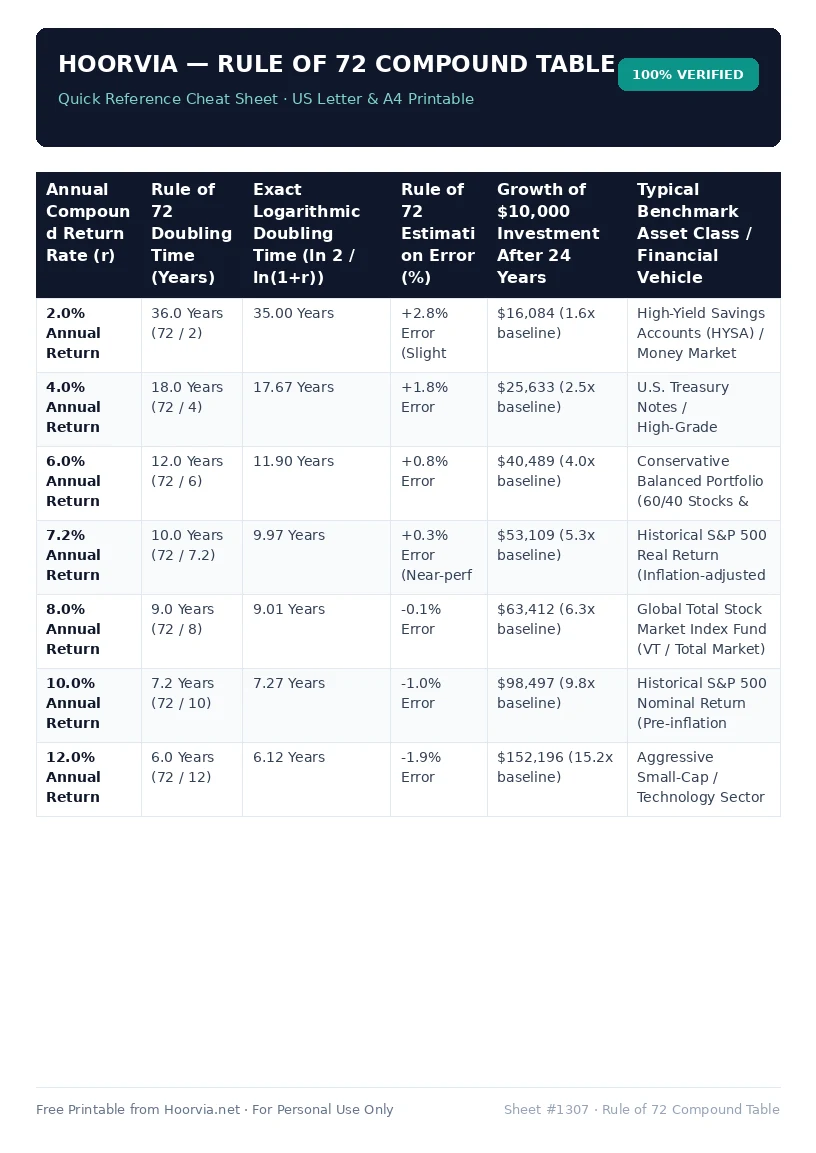
Download Your Free Printable Sheet
Download the printable PDF below. It is the same sheet shown in the preview above, ready to print on US Letter or A4 — open it and choose Print, with Scale set to Fit to Page.
💡 Pro Printing Tip: In your printer settings, set Scale to “Fit to Printable Area” and enable “Background Graphics” for color headers.