TradingView Pine Script Reference Sheet
Pine Script v5 basics: plot, indicators, inputs, conditions and strategy calls — a quick reference for TradingView scripters.
Pine Script lets TradingView users build custom indicators and strategies, but its syntax is easy to forget between scripts. This reference covers Pine v5 essentials — declarations, plots, inputs, moving averages, conditions and strategy entries — so you can sketch a script without re-reading the full manual each time.
Quick-Reference Table
The full data from this cheat sheet, right on the page.
| Concept | Pine Script v5 Example | What it does |
|---|---|---|
| Version declaration | //@version=5 | Must be the first line; v5 is current |
| Indicator declaration | indicator("My Indicator", overlay=true) | Creates an indicator (overlay = on price chart) |
| Strategy declaration | strategy("My Strategy", overlay=true) | Creates a backtestable strategy |
| Input | len = input.int(14, "Length") | User-adjustable setting in script settings |
| Simple moving average | sma = ta.sma(close, len) | Average of last ‘len’ closes |
| Exponential moving average | ema = ta.ema(close, len) | Weighted to recent prices |
| RSI | rsi = ta.rsi(close, 14) | Relative Strength Index, 0–100 |
| Plot | plot(ema, color=color.blue) | Draws a line on the chart |
| Plot shape | plotshape(crossover, style=shape.triangleup) | Marks an event on the chart |
| Background colour | bgcolor(color.new(color.green, 90)) | Colours the chart background |
| Crossover condition | cross = ta.crossover(ema, sma) | True on the bar where EMA crosses above SMA |
| Strategy long entry | if cross strategy.entry("Long", strategy.long) | Opens a long position on the condition |
| Strategy close | strategy.close("Long") | Closes the named position |
| Alert condition | alertcondition(cross, "Cross!", "EMA crossed SMA") | Creates an alert you can set in TradingView |
| Previous bar value | prevClose = close[1] | [1] = one bar ago, [2] = two bars ago |
Printable Sheet Preview
High-Contrast Layout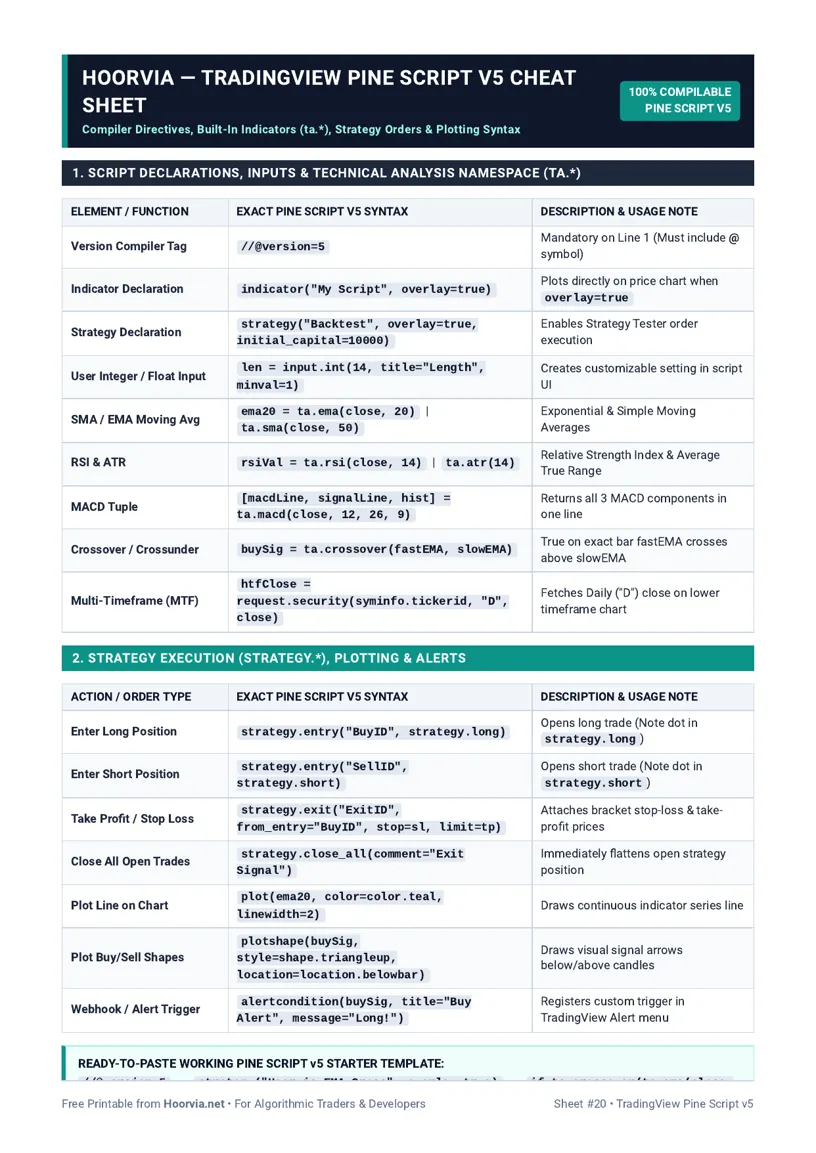
Download Your Free Printable Sheet
Download the printable PDF below. It is the same sheet shown in the preview above, ready to print on US Letter or A4 — open it and choose Print, with Scale set to Fit to Page.
💡 Pro Printing Tip: In your printer settings, set Scale to “Fit to Printable Area” and enable “Background Graphics” for color headers.
How to Print & Use This Chart
Print on US Letter or A4 and keep it beside your keyboard while you write your first Pine scripts, or save it as a PDF via “Save as PDF” in the print dialog (Letter or A4) for a second monitor. A printed reference helps because Pine’s function names — ta.sma, ta.ema, ta.crossover — are easy to mistype from memory, and a single typo stops a script compiling. Laminate it if your desk is busy, and annotate it with the indicators you actually use, so the sheet grows into your personal snippet library rather than staying generic.
Start every script with //@version=5, then decide whether you need indicator() for a chart overlay or strategy() for backtesting — they are not interchangeable, and strategy functions only work in a strategy script. Use input.int and input.float for lengths and thresholds so you can tune a script from its settings panel without editing code. Build in small steps: plot one moving average, check it looks right, then add a second line and a crossover condition, then an alert or strategy entry. Use the historical-bar operator [1] carefully — it refers to the previous closed bar, not the current live bar — and never treat a backtest as proof a strategy will profit in live markets. Backtests ignore slippage, fees and changing market conditions unless you model them, so treat Pine as a learning and analysis tool first, and get independent financial advice before risking real money.
Frequently Asked Questions (FAQs)
What is the first line of a Pine v5 script?▼
//@version=5. Without it, TradingView may compile the script as an older version with different syntax.
Indicator vs strategy — what is the difference?▼
indicator() draws on a chart. strategy() also backtests trades and shows performance, but strategy functions only work in a strategy script.
What does close[1] mean?▼
The close price one bar ago. [2] is two bars ago. It is used to compare the current bar with previous bars.
Can I trust a profitable backtest?▼
No — backtests do not guarantee future results. They ignore real-world slippage, fees and regime changes. Treat them as a starting point, not a promise.